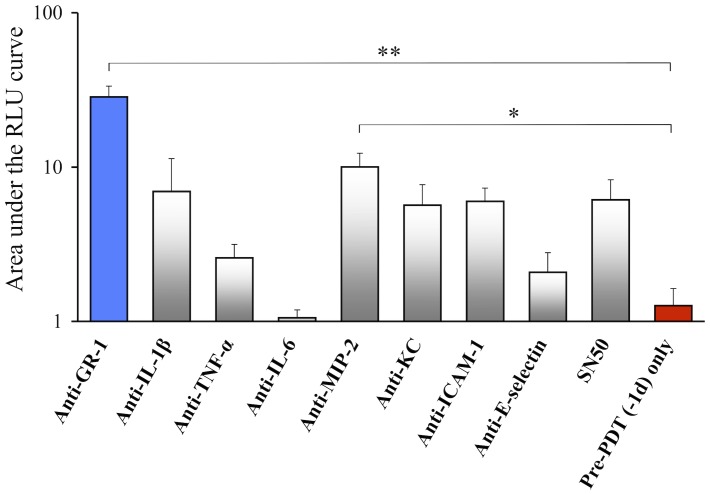
Figure 10. Effect of blocking antibodies on Pre-PDT response.
Comparison of the area under the RLU curve (AUC) in the Pre-PDT (−1d) + each antibody groups and the Pre-PDT (−1d) group. These values were determined from the time courses shown in Figure S3. n = 5 each. *P<0.05, **P<0.01.

