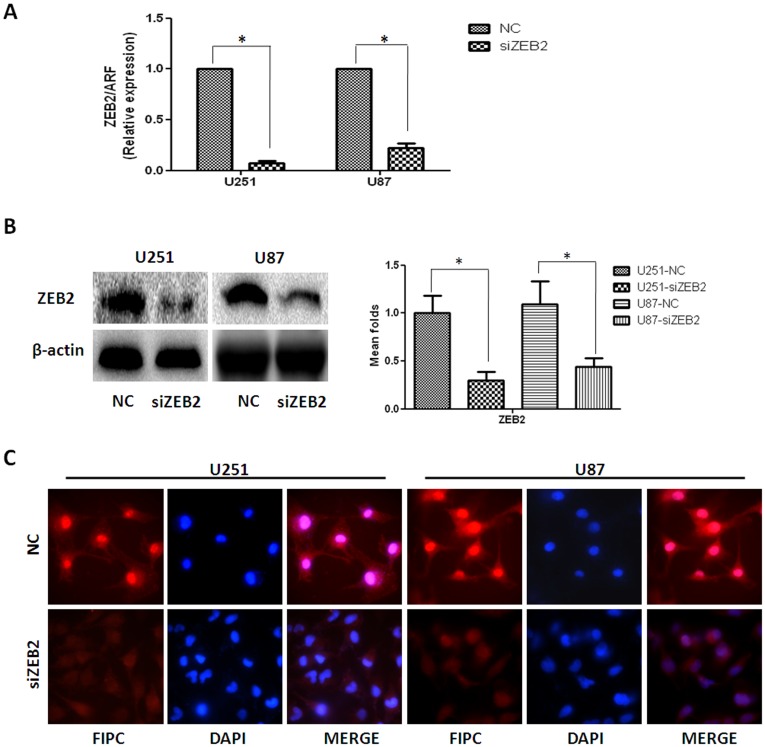
Figure 2. Effect of siRNA interference on ZEB2 expression in human glioma cell lines U251 and U87.
Different treatments included negative control (NC) and siZEB2-transfected groups (siZEB2). A. RT-PCR shows transcriptional levels of the ZEB2 gene 48 hr post transfection and ARF was used as a loading control. The arbitrary units were plotted using mean ± SD of at least three individual repetitions. B. Western blot showing protein expression levels in NC and siZEB2 treatments. At 72 hr post transfection, cells were harvested and whole cell lysates prepared using RIPA buffer. The representative image of three different repetitions is shown. β-actin served as a loading control. Bar graph shows the relative expression of protein among the groups. Data are presented as mean ± SD for three independent experiments. C. Immunofluorescence study using blinded analysis showing the expression of ZEB2 in NC and siZEB2-treated U251 and U87 cells at 48 hr post-transfection (Original magnification 1000×). *P<0.05, statistically significant difference.

