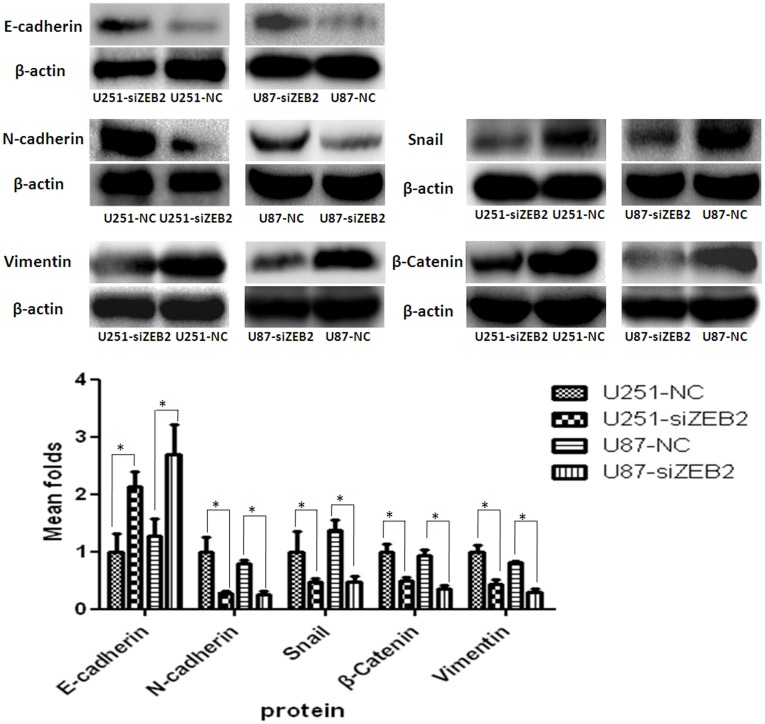
Figure 4. ZEB2 downregulation promotes expression of E-cadherin but suppresses EMT progression in glioma cells.
ZEB2 reduction enhanced expression of E-cadherin and expression level changes of N-cadherin, Snail, β-Catenin and Vimentin in U251 and U87 cells at 72 hr post-transfection. β-actin was used as a loading control. Bar graph shows the relative expression of protein among the groups. Data are presented were presented as mean ± SD for three independent experiments. *P<0.05, statistically significant difference.

