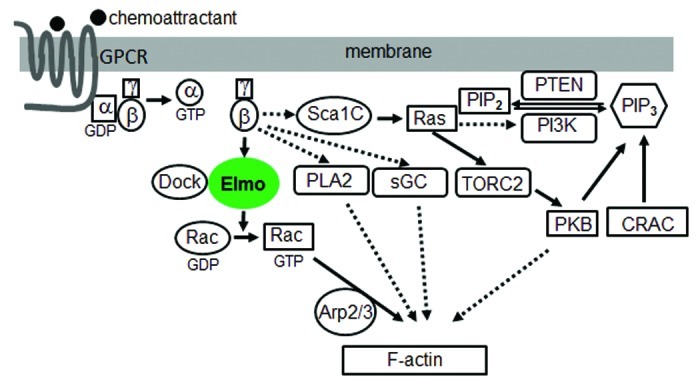
Figure 1. A model of the signaling network from GPCR to the actin cytoskeleton during chemotaxis. Solid lines indicate association and dashed lines indicate a lack of data for association.

Figure 1. A model of the signaling network from GPCR to the actin cytoskeleton during chemotaxis. Solid lines indicate association and dashed lines indicate a lack of data for association.