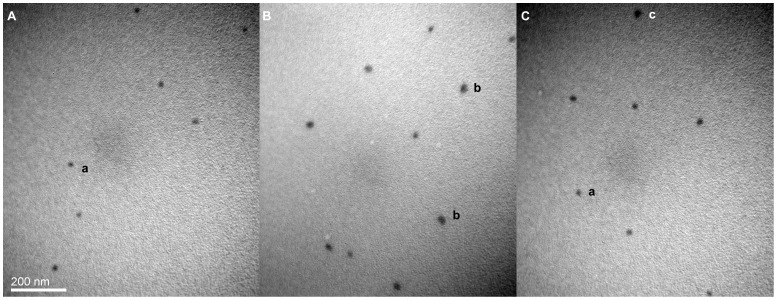
Figure 5. Representative transmission electron micrograph of mPEG-rCU.
(A), (B) and (C) represent mPEG-rCU-1, mPEG-rCU-2 and mPEG-rCU-3.The magnification is 100000×, scale bar: 200 nm. a, b and c may correspond to PEGylated tetrameric uricase, PEGylated aggregated uricase, and cross-linked conjugates induced by PEG diol, respectively.

