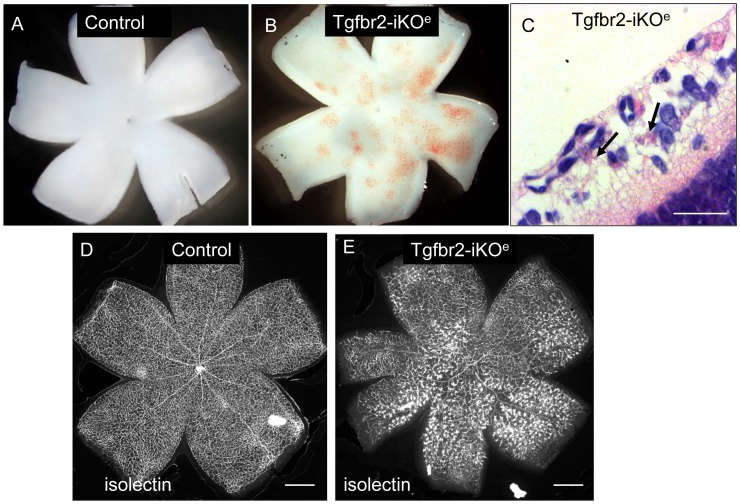
Figure 3. Retinal haemorrhage in Tgfbr2-iKOe neonates upon development of the secondary vascular plexus.
Stereo-images of freshly dissected whole mount P9 retinas show multiple microhaemorrhages in the Tgfbr2-iKOe that are not seen in controls (A,B). H&E stained sections of Tgfbr2-iKOe retina show regions of microhaemorrhage within the retinal tissue (arrows,C). Wholemount view of isolectin stained P14 retinas show multiple glomerular tufts (seen as intensely stained clumps of ECs) in the Tgfbr2-iKOe mutants that are not seen in controls (D,E). This phenotype was seen in over 100 mutant retinas from P8 to P28. Scale bars: 500 µm, C,D; 20 µm C.

