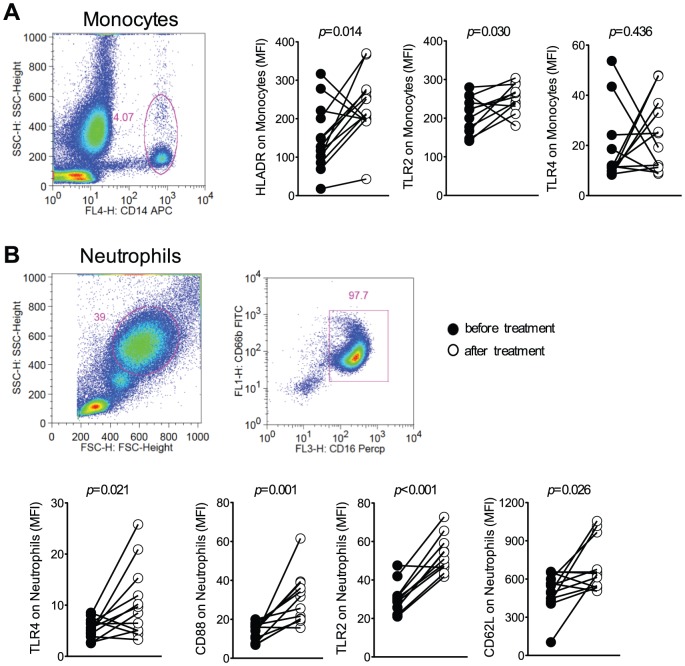
Figure 2. Systemic activation of monocytes and neutrophils during P. vivax malaria.
Mean fluorescence intensity (MFI) of HLA-DR, TLR2 and TLR4 was evaluated on monocytes (A) and CD62L, CD88, TLR2 and TLR4 on neutrophils (B) in whole blood from P. vivax-infected subjects (n = 12), before (closed circles) and 30–45 days after treatment (open circles). Representative density plots showing the gate strategy for monocytes CD14+ (A) and neutrophils CD66b+CD16+ (B) are shown. Significant differences are indicated with p-values using Wilcoxon signed rank test when the data failed the normality test.

