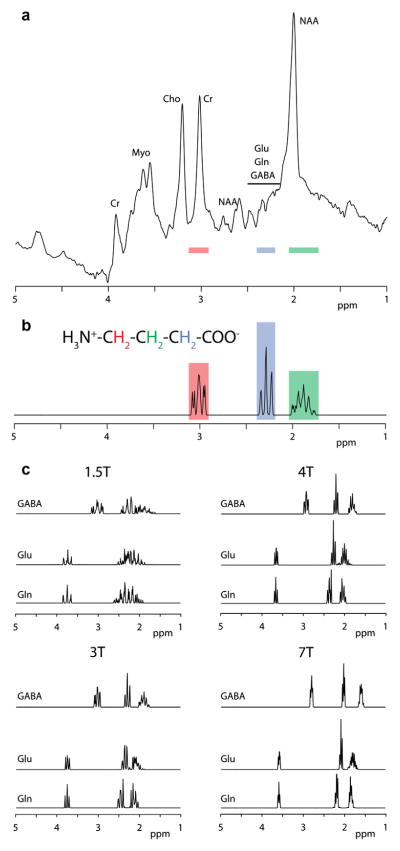
Fig. 1.
MR spectra of GABA. (a) 1H MR spectrum of the human brain acquired at 3T, showing peaks corresponding to N-acetyl aspartate (NAA), creatine-containing compounds (Cr), choline-containing compounds (Cho), Myoinositol (Myo), glutamate (Glu), glutamine (Gln) and GABA. Coloured bars correspond to the simulated peak locations in (b). (b) Simulated MR spectrum of GABA at 3T, showing the assignments to the GABA CH2 spins. (c) Simulated MR spectra of GABA, Glu and Gln at a range of field strengths.

