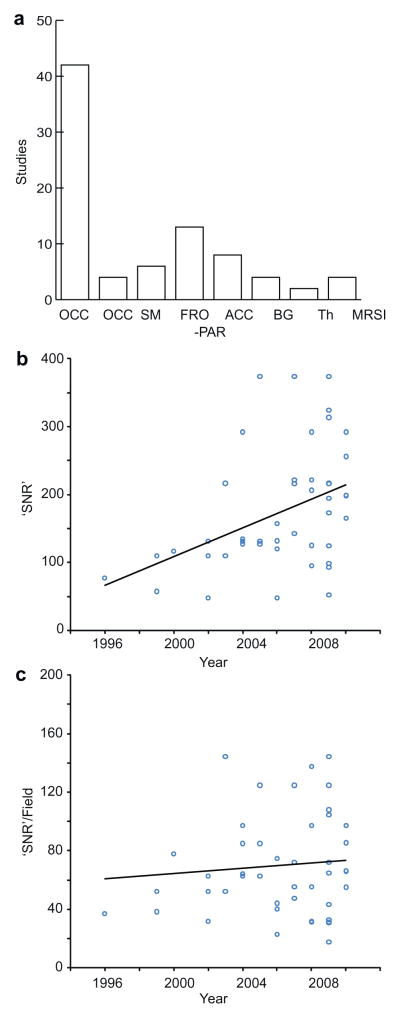
Fig. 3.
Literature review. (a) Histogram of brain regions studied (OCC occipital; PAR parietal; SM sensorimotor; FRO frontal; ACC anterior cingulate; BG basal ganglia; Th Thalamus). (b) Plot of ‘SNR’ metric (volume × √(experiment time)) against year of publication. (c) Plot of ‘SNR’ metric divided by field strength against year of publication.

