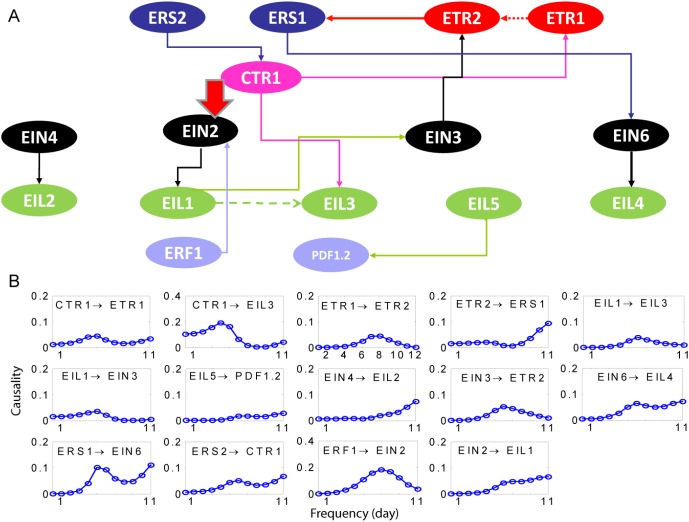
Figure 5. A circuit of ethylene pathway.
A. An ethylene gene circuit with around 16 genes. Only genes with interactions are shown here. The thick arrow is the complex interaction between {CTR1, ETR1 and ERS2} and EIN2. B Interactions in the frequency domain calculated in terms of PGC. Only 14 significant interactions are shown.

