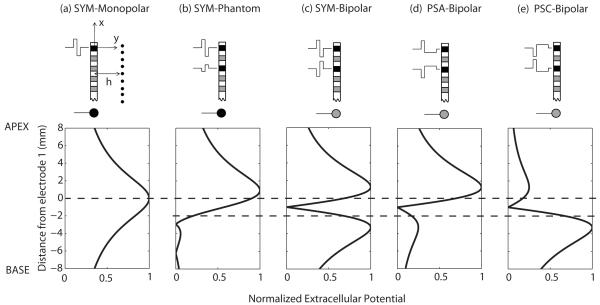
Figure 1.
Top: Schematic illustration of different stimulation techniques. The black electrode contacts are the active contacts. The gray contacts are not active. The ball electrode at the bottom represents the extracochlear ground. Neurons are located at a distance h from the electrode array. Bottom: Predicted voltage distributions along the x axis for (a) symmetric monopolar, (b) symmetric phantom, (c) symmetric bipolar, (d) pseudomonophasic anodic-first bipolar, and (e) pseudomonophasic cathodic-first bipolar. Only positive voltage deflections are shown. For illustration purposes, neighboring electrodes are assumed to be separated by 1 mm., which corresponds approximately to the separation found in the HiRes 90k implant, h is assumed to be 3 mm and the fraction of current returning to electrode E3 in condition (b) is 0.75. The voltage plots are normalized re the maximum. The dashed lines indicate the positions of the active intracochlear electrode(s) E1 and E3.

