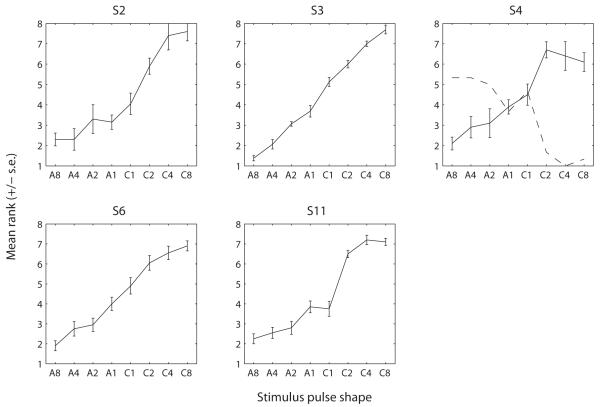
Figure 6.
Results of Experiment 2a. Each panel shows the results for one subject. As for Figure 3, the function shows the mean pitch rank (and standard error) as a function of the pulse shape. The dashed line in panel S4 shows the results of the same task repeated in a subsequent session (discussed in the Section III.B.2).

