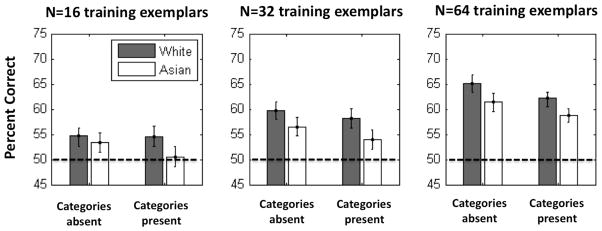
Figure 4.
Mean percent correct performance on simulated VPC trials for own-and other-race stimuli as a function of N and the presence or absence of racial categories. When categories are “absent,” cross-race difference images are included during training – when they are “present,” those differences are not included. Error bars represent 99% confidence intervals of the mean. The dashed line in each plot indicates chance performance of 50%.

