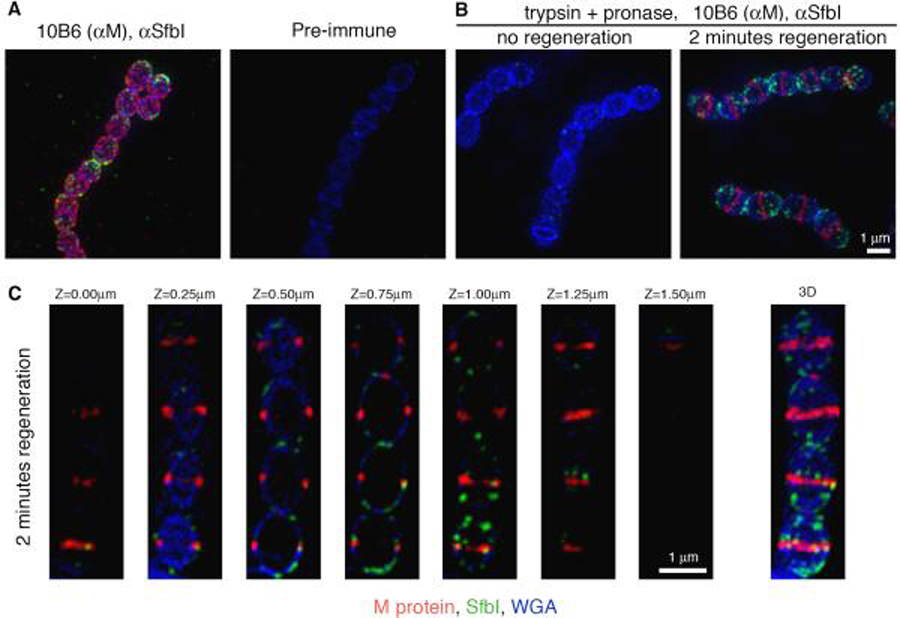
Figure 1. The relative anchoring patterns of M protein and SfbI.
An overnight S. pyogenes D471 culture was diluted 1:100 into TH+Y (A), or TH+Y containing trypsin and pronase (B), and fixed upon reaching OD600 0.5 (A, and B “no regeneration”). Protease treated cells were also harvested at OD600 0.5, washed, and resuspended in TH+Y for 2 minutes at 37°C prior to fixation (B “2 minutes regeneration”, and C). Specific antibodies were used to label M protein (red) and SfbI (green). The cell wall was stained with WGA marina blue (blue). 3D-SIM microscopy images are presented as maximum intensity projections composed of all the Z-sections (A and B), or as sequential Z-sections (C).

