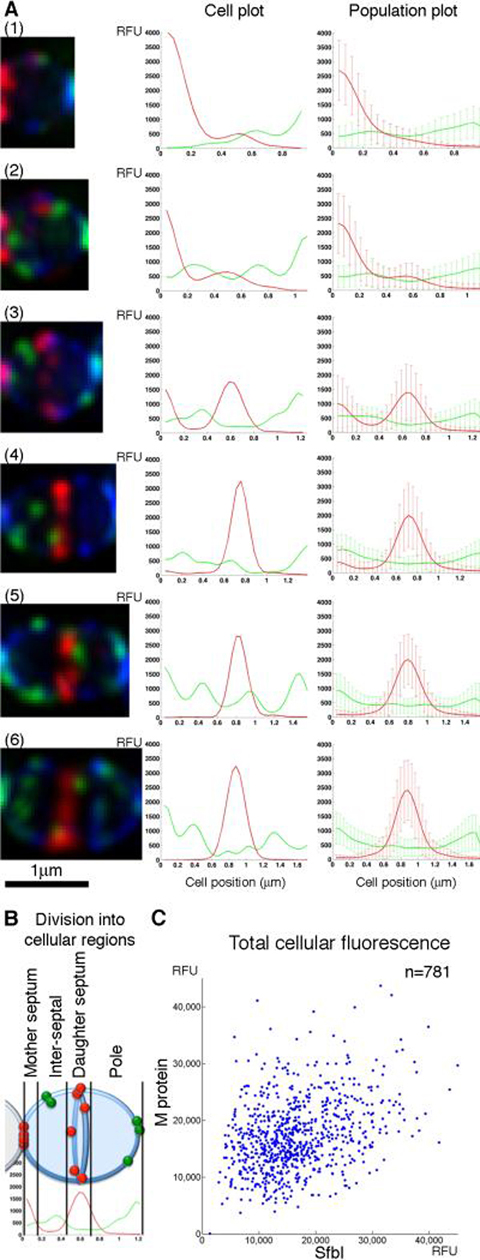
Figure 2. M protein and SfbI are anchored simultaneously throughout the cell cycle.
(A) An overnight S. pyogenes D471 culture was diluted 1:100 into TH+Y containing trypsin and pronase and incubated at 37°C to OD600 0.5, at which point the cells were washed, and resuspended in TH+Y without proteases for 2 minutes at 37°C prior to fixation. The cells were labeled for M protein (red), SfbI (green) and wall (WGA, blue). Average intensity 3D-projections were made for numerous DeltaVision images, resulting in a population of 781 cells. These cells were divided according to cell length to 6 groups, representing different stages of the cell cycle. Each cell was divided into pixel-wide strips, parallel to the division plane, and the total fluorescence intensity was calculated for each strip. These data, when plotted against the relative position in the cell, produced the cellular distribution plots. Representative cells for each division stage are presented on the left, and their respective plots are presented on the middle column. For each division stage, the group's average fluorescent signal distribution and standard deviation values are presented on the right. (B) A representation of the cellular regions of a streptococcal cell, as used in this study. (C) A plot displaying the total M protein fluorescence value for each cell in the population, plotted against its total SfbI fluorescence.

