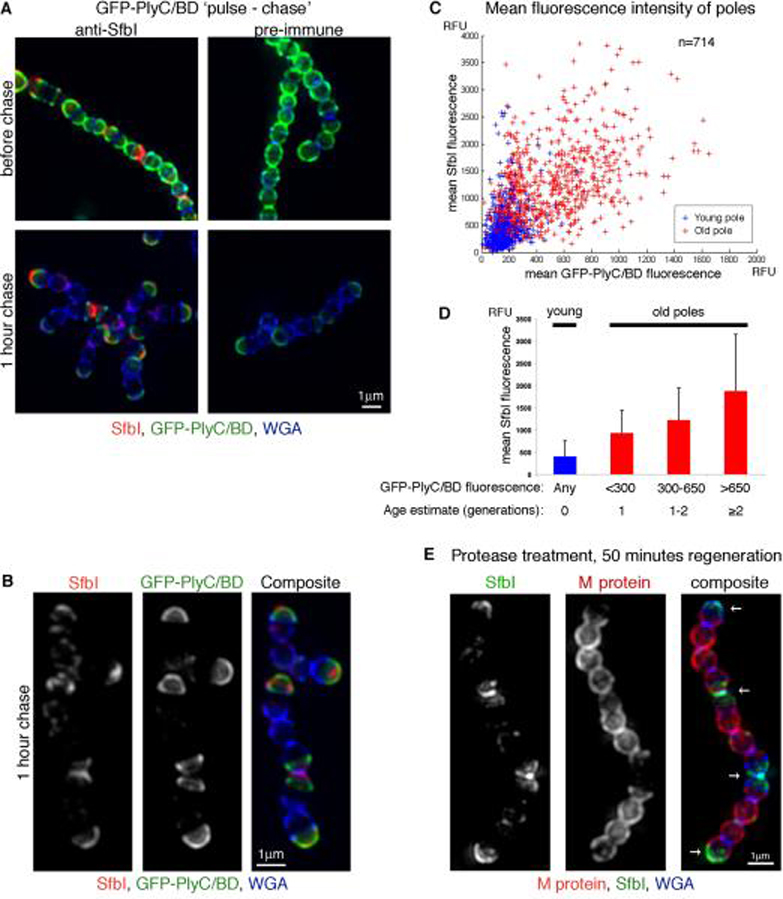
Figure 4. Gradual accumulation of SfbI results in polar distribution.
An overnight S. pyogenes D471 culture was diluted 1:100 into TH+Y and grown to OD600 0.15, at which time GFP-PlyC/BD (green) was added to the medium for 30 minutes (“pulse”). The cells were then washed and suspended in TH+Y for one hour at 37°C (“chase”) prior to fixation. SfbI was stained using a specific serum (red), and the cell wall was stained using WGA marina blue (blue). (A) Representative cells before and after the “chase” period. (B) Streptococcal chains following the “chase” period alongside the separate fluorescent channels. (C) Average intensity 3D-projections were made for numerous DeltaVision images, resulting in a population of 714 cells. The signal distribution plots of these cells were analyzed using MATLAB. Each cell was divided into “young pole” (blue) and “old pole” (red) regions. For each pole, the mean GFP-PlyC/BD and SfbI fluorescence values were plotted against each other. (D) The “old pole” group was sub-divided into 3 groups according to GFP-PlyC/BD fluorescence, representing the estimated age of the pole. The mean SfbI fluorescence the standard deviation values are presented for each group, as well as for the “young pole” group in its entirety. (E) An overnight S. pyogenes D471 culture was diluted 1:100 into TH+Y containing trypsin and pronase, and incubated at 37°C to OD600 0.5, at which point the cells were washed, and resuspended in TH+Y without proteases for 50 minutes at 37°C prior to fixation. Specific antibodies were used to label M protein (red) and SfbI (green). The cell wall was stained with WGA marina blue (blue). Arrows denote wall regions that were already assembled at the time of protease treatment. DeltaVision images for (A), (B), and (E), are presented as maximum intensity 3D-projections.

