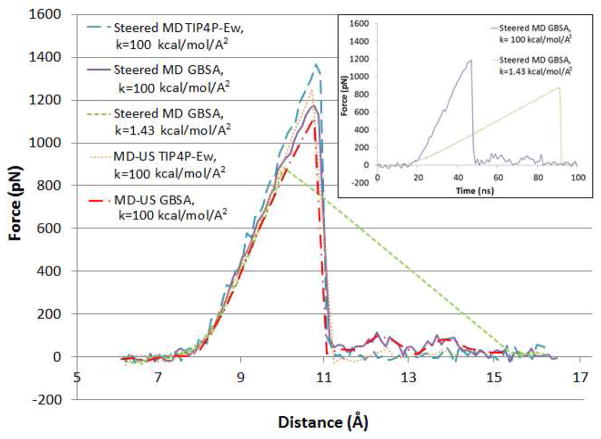
Figure 3.
Force vs. N1-C1 interatomic distance plots for the dissociation of the CB[7]-B5 complex, obtained from pulling calculations and MD-US simulations. The pulling data points correspond to averages over 1ps intervals, while the US data points are averages for each sampling window. The inset illustrates force vs. time plots for the stiff and soft GBSA pulling calculations, whose colors match the corresponding curves of the main graph.

