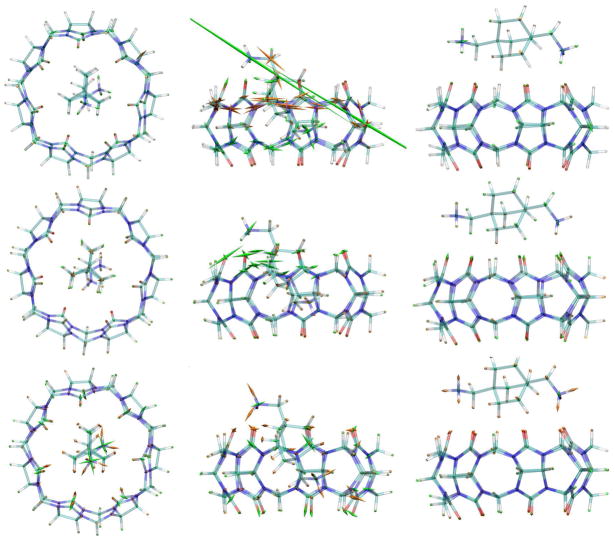
Figure 5.
Representations of the average bond (top row), LJ (middle row) and electrostatic (bottom row) stresses of CB[7]-B5, for three key points along the stiff-restraint N1-C1 MD-US dissociation pathway. These correspond to the initial (N1-C1 distance = 6 Å, left column), peak-force (10.8 Å, middle column), and after-peak (11.1 Å, right column) states. The average stresses are superimposed on a representative structure for each case, whose atoms are color coded as indicated in Fig. 1. The spindle-shaped glyphs show the directions and magnitudes of the principle stresses, and green and orange indicate compressive and tensile stresses, respectively. The glyphs are scaled by 0.2vloc (see main text).

