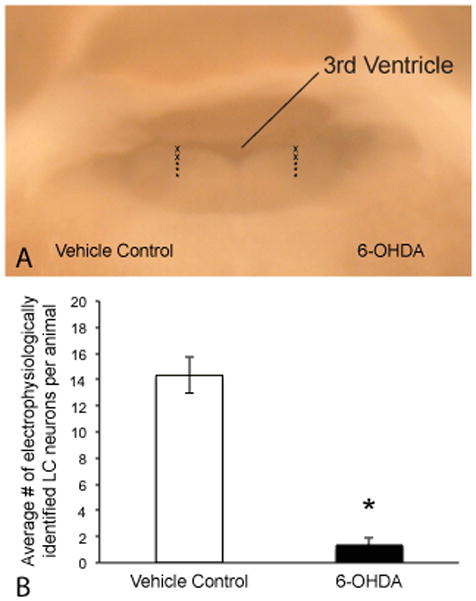
Figure 2.

Electrophysiological confirmation of neuron loss following 6-OHDA injection. A) Digital image of 300mm thick acute slice containing the LC (view from caudal most aspect of the LC) just prior to electrophysiological recordings. Image demonstrates the approximate recording sites used to assess viable LC neurons comparing the vehicle-treated side (left) with the 6-OHDA injected side (right). Approximately 5–6 recording tracks were run on each side along the dorsal-ventral axis of the LC. Asterisks (lower three) identify the tracks in which most LC cells were observed (particularly in the 6-OHDA side). B) The average number of viable cells identified by characteristic electrophysiological properties (negative shift in voltage, increased input resistance and action potential firing) were significantly greater in the vehicle-treated side compared to the 6OHDA-treated side (n=9; paired student’s t-test p<0.0001).
