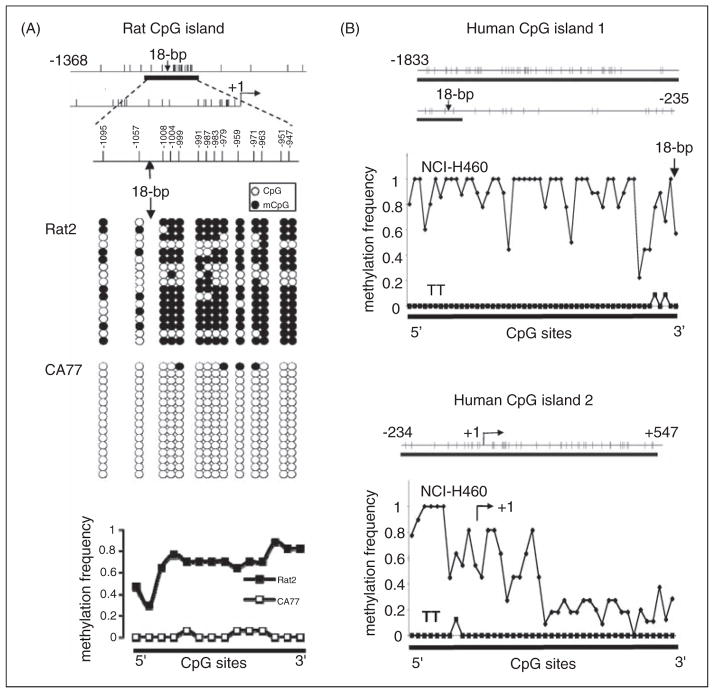
Figure 1.
Methylation status of CpG islands flanking the 18-bp CALCA enhancer. (A) CpG island in the rat CALCA promoter region. Each vertical line represents a CpG dinucleotide within the region shown relative to the transcription start site (at +1 bp). The CpG island is shown as a thick horizontal bar and location of the 18-bp enhancer is indicated. Unmethylated CpG (open circles) and methylated CpG (mCpG, filled circles) sites within the island are shown from 17 Rat2 clones and 16 CA77 clones. Each row represents one clone. Methylation frequency at each CpG in Rat2 and CA77 cell lines is shown from left to right (not to scale). The methylation frequency is the number of clones with methylated CpG divided by the total number of clones. (B) CpG islands in the human CALCA promoter region. CpG island 1 (upper panel) in the distal promoter region and CpG island 2 (lower panel) in the proximal promoter region of CALCA are shown as thick horizontal bars. Each vertical line indicates one CpG site within the indicated region (base pairs relative to transcription start site). The methylation frequencies of CpG sites in NCI-H460 clones (9 and 11 for islands 1 and 2, respectively) and TT clones (11 and 8 for islands 1 and 2, respectively) were calculated as in panel A. If the sequence was not clear, the CpG from that clone was not included in the calculation (>5 clones used for all sites).

