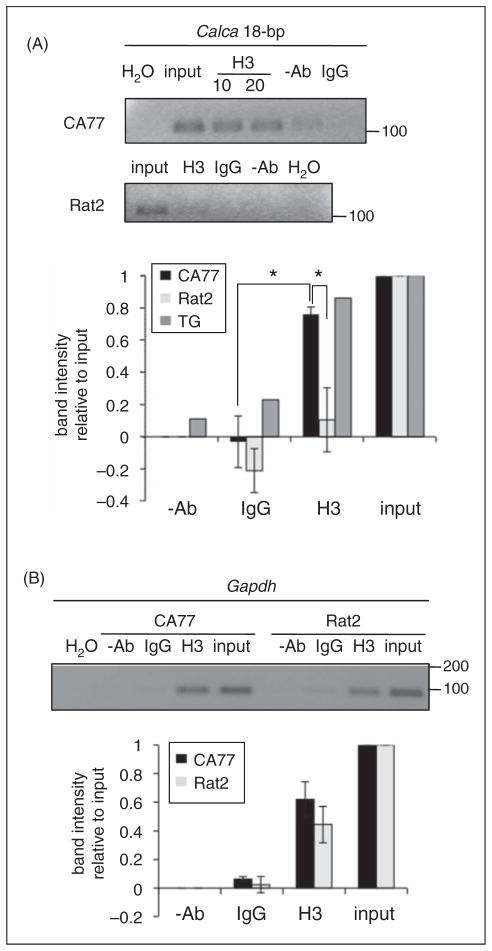
Figure 2.
Acetylation of histone H3 at the 18-bp enhancer. (A) CA77 cells, Rat2 cells or neonatal rat trigeminal ganglia (TG) tissues were harvested for ChIP with antibodies against AcH3K9, K14 (H3). For CA77 cells, two amounts of antibody were used (10 and 20 μg). Chromatin immunoprecipitation (ChIP) with rabbit immunoglobulin G (IgG), without antibodies (-Ab), and with H2O in place of DNA were negative controls. For normalization of the polymerase chain reaction (PCR) signals, 1% of the input DNA was included. Size markers (bp) are indicated. Band intensity was measured with histogram analysis using Image J software. Mean and standard error (SE) from three independent assays with CA77 and Rat2 cells (*, p<.05, Student’s t-test). For trigeminal ganglia, the band intensities are from a single experiment. (B) ChIP assay with primers spanning the GAPDH promoter region. Band intensities were measured as described in panel A, with mean and SE from three independent assays.

