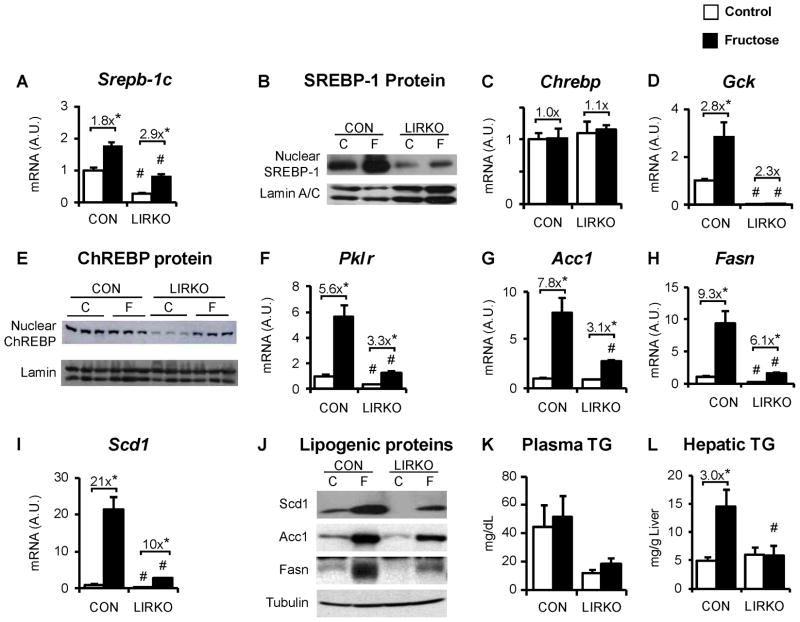
Fig. 5. Effects of fructose feeding on LIRKO livers.
LIRKO mice and their littermate controls (CON) were placed on either a chow (C, Chow) or high fructose diet (F, 60% fructose by weight) for one week and were sacrificed in the non-fasted state. Livers were analyzed for gene expression and triglyceride content. (A, C–D, F–I) Gene expression was measured by real-time PCR. (B) SREBP-1 and (E) ChREBP proteins were measured by immunoblotting nuclear extracts. (J) Acc, Fasn and Scd1 were measured by immunoblotting liver lysates. (K) Plasma and (L) hepatic triglycerides were measured at the time of sacrifice. Error bars represent S.E.M.; n=4–8, *p<0.05 versus chow-fed mice of the same genotype; #p<0.05 versus control mice on the same diet; equal amounts of liver from three mice were pooled to prepare samples for immunoblotting SREBP-1, Acc, Fasn and Scd1; for ChREBP immunoblot, each lane represents an individual mouse liver. See also Figure S5.

