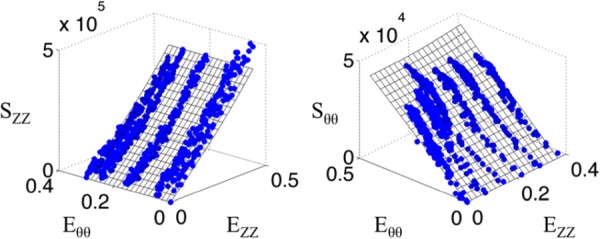
Fig. 8.

Representative stress versus strain plots for tubular mechanical test of a wild-type mouse aorta. Axial stress is represented on the left, while circumferential stress is represented on the right. Blue data points represent the acquired data and the surfaces represent a Fung fit.
