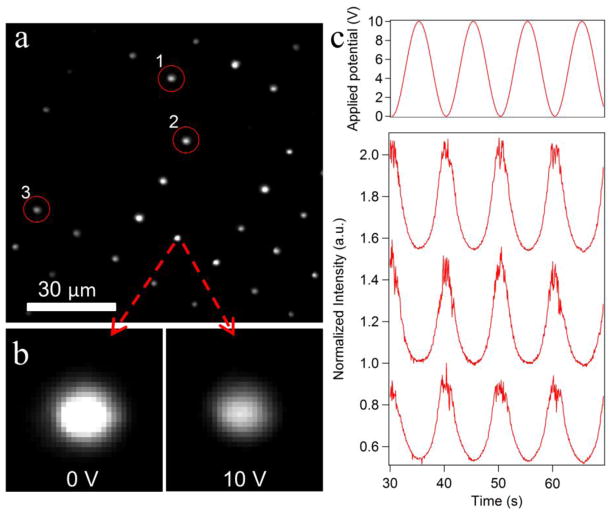
Figure 10.
(a) TIRF image extracted from a movie of the beads bound to ssDNA molecules attached at low density at the bottom of the well s. The image was taken at 0V (i.e. when the probes were closest to the surface). (b) When the AC voltage amplitude changes from 0 V to 10 V, the brightness of the probe drops approximately 50%, consistent with the probe being pulled away from the surface and the DNA molecule being stretched. (c) Applied potential and raw fluorescence intensity data (normalized to a maximum intensity observed in a given trace) versus time for three beads circled in part (a). Intensity traces are shifted with respect to each other for clarity.

