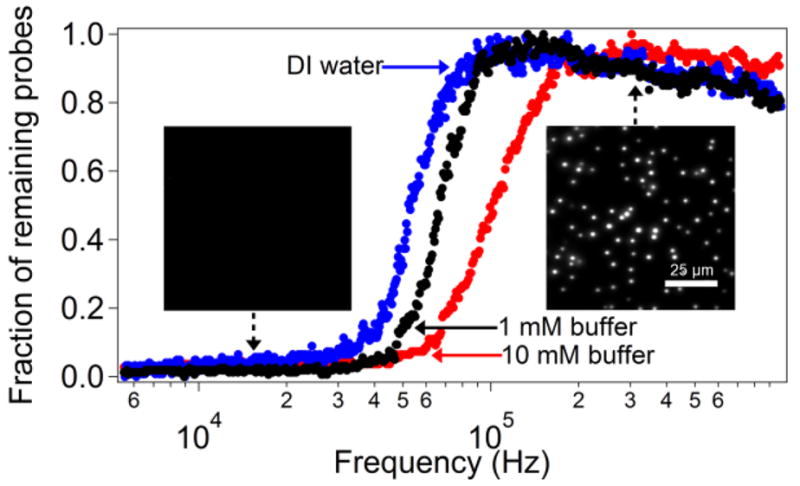
Figure 5.

The number of polystyrene microspheres remaining on the surface of the electrode as the frequency of the applied AC field is changed from 1 MHz to 1 kHz in DI water or phosphate buffer. The number of probes is normalized to the maximum detected during a given sweep. In the negative DEP regime (high frequency), the number of probes slowly increases in the course of the experiment as more probes approach the surface from the bulk of the solution and accumulate at the surface due to attractive DEP forces. (left inset) TIRF image of a sample of probes when 10 V potential is applied at 200 kHz. The probes overcome the electrical double layer repulsion and land on the surface when the field is turned on. The intensity is high, indicating a close proximity to the surface. (right inset) Image of the same sample at a frequency of 10 kHz (10 V potential). Probes are no longer visible using TIRF microscopy.
