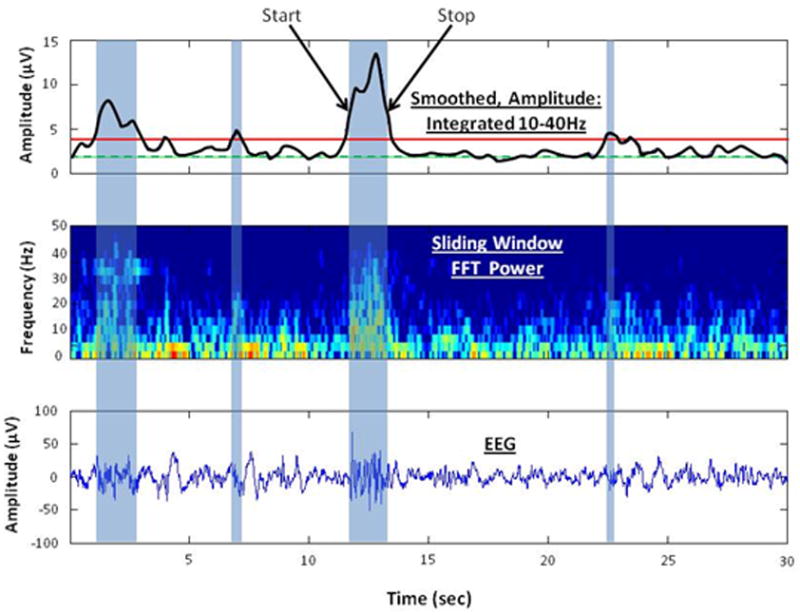
Figure 1.

Depiction of the burst detection algorithm to identify bursts of high frequency activity. The lower panel shows 30 sec of EEG and 4 high frequency bursts of varying duration (blue shaded areas). The middle panel shows the sliding window, 32 point FFT spectral time series from 0 to 40 Hz. Increasing amounts of power are depicted with a color scale from blue to red. The top panel shows the sum of power in the spectral time series between 10 and 40 Hz, smoothed with a 2 Hz low pass filter (black curve). The threshold for burst detection (red solid line) was defined as two times the 10th percentile (green dashed line) of the smoothed power. Each high frequency burst was characterized by peak amplitude, start and stop times corresponding to half peak power, and mean spectral frequency within the burst.
