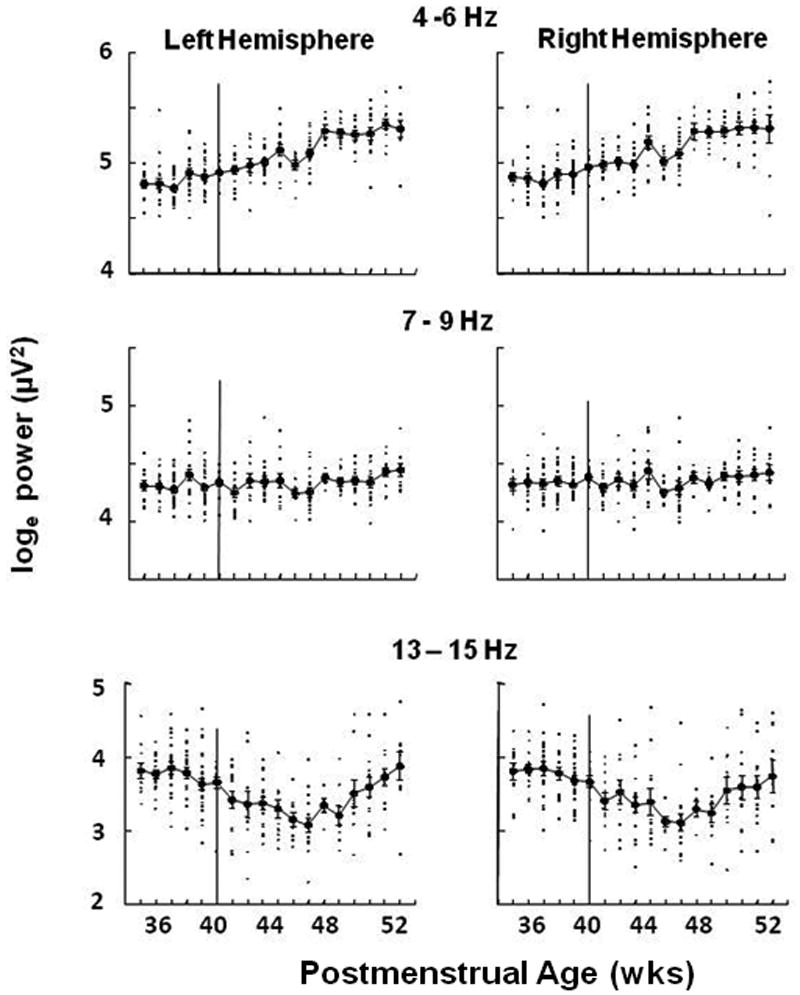
Figure 2.

EEG power (loge, μv2) in 3 frequency bands plotted against postmenstrual age in weeks. Individual points (small filled squares) are the mean values of ∼900 30 second epochs during overnight polysomnographic studies for each baby. Each baby was studied at only one age. Also shown are means (larger filled circles) ±SE for babies with recordings at the same age (N ranged from 5 to 29, with 14 of 18 ages having N>10). Data from the left hemisphere bipolar leads (C3, O1) are given in the left panel; data from the right hemisphere bipolar leads (C4, O2) are given in the right panel.
