
Figure 7.
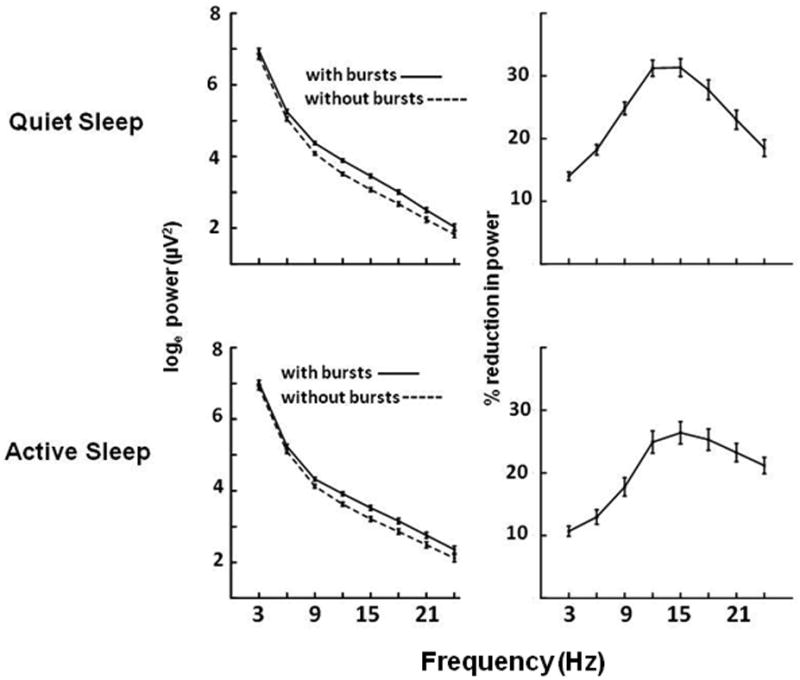
Effects of removing bursting activity on the EEG. In the top left panel the solid line shows the loge of total power (mean ± SE, μV2) in 3Hz bands during Quiet Sleep in 22 infants <37 weeks postmenstrual age. The dashed line shows the power remaining after excluding bursting activity. The panel on the upper right shows the mean (±SE) percent reduction in power caused by burst removal. The lower panels show these results for Active Sleep.