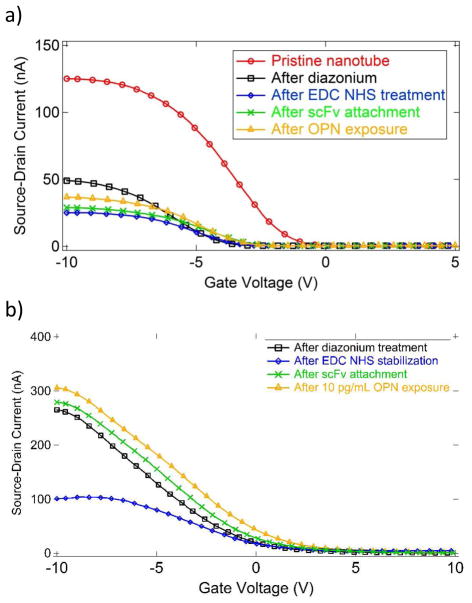
Figure 3.
a) I–Vg characteristics for a single device after successive functionalization steps. Exposure to OPN at a concentration of 30 ng/mL (912 pM) caused the ON state current to increase from 29 nA (green curve) to 37 nA (orange curve), an increase of 27%. b) Similar data for exposure to OPN at a concentration of 10 pg/mL (304 fM). The ON state current increases from 276 nA to 307 nA, an increase of 11%.

