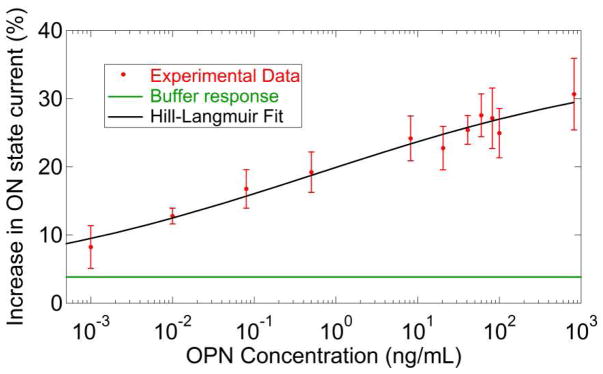
Figure 4.
Measured sensor responses over a wide range of concentrations of osteopontin (OPN). The solid line is a fit using a modified Hill-Langmuir expression that includes an offset response of 4% due to the buffer itself (see main text). A clear signal is still present at OPN concentrations of 1 pg/mL.

