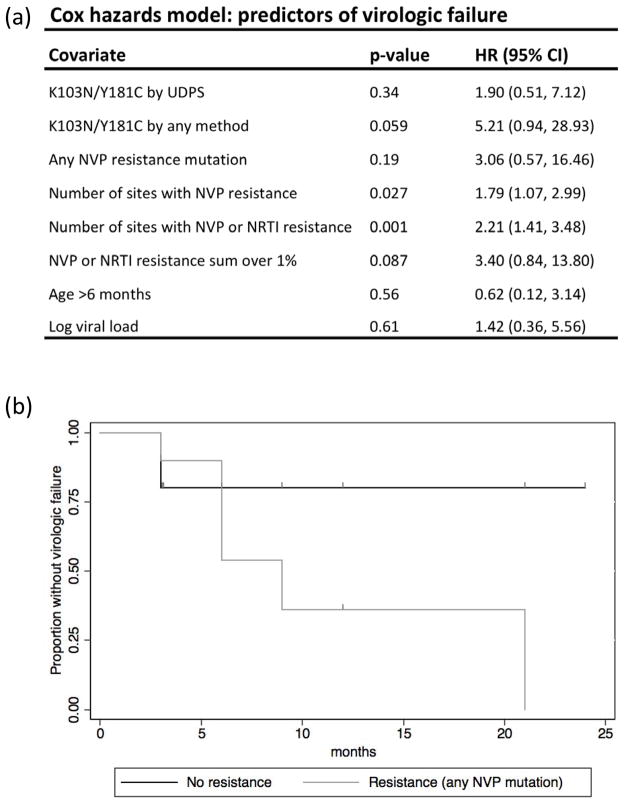
Figure 1. Predictors of virologic failure.
(a) Univariate Cox proportional hazards models used to determine associations between pre-HAART characteristics and virologic failure. (b) Kaplan-Meier curve of the proportion of infants without virologic failure comparing infants with no detectable pre-HAART NVP resistance by UDPS (black line) to infants with any level of any NVP resistance mutation at baseline (grey line).

