
Figure 3.
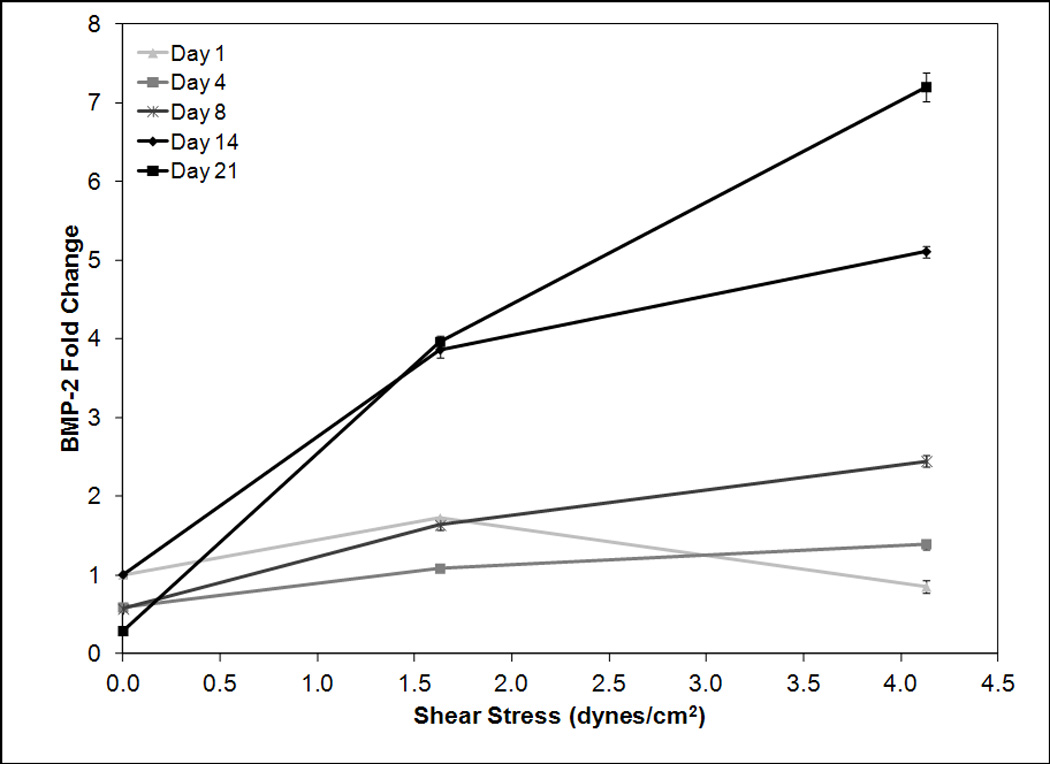
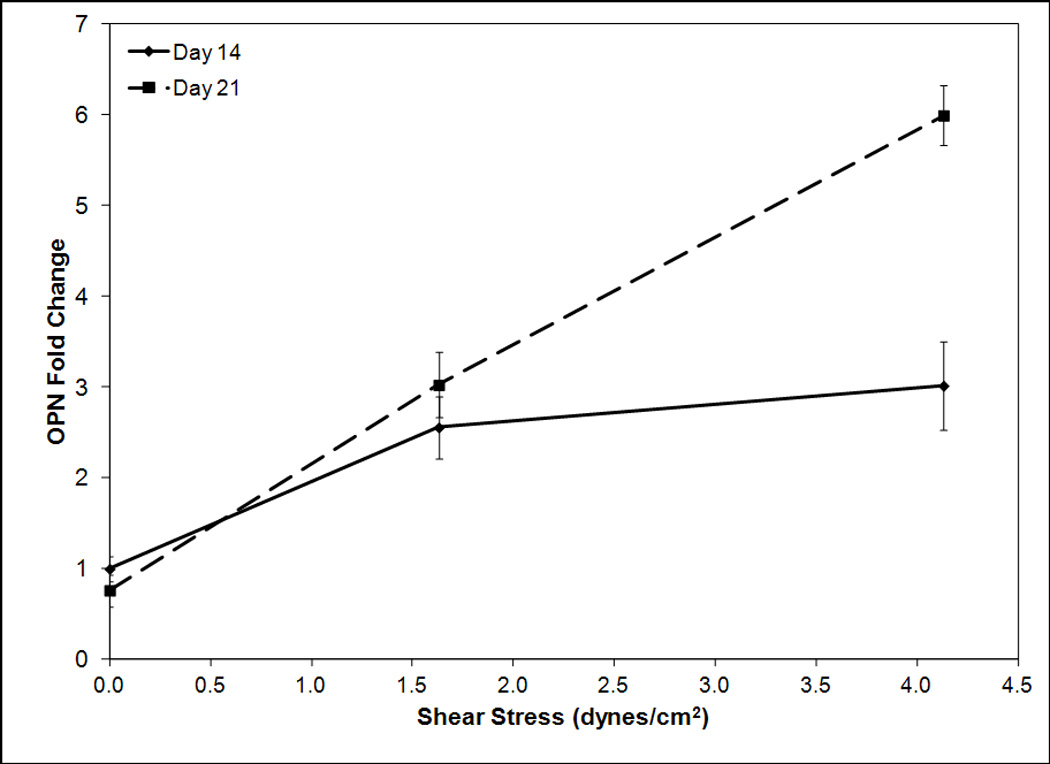
RT-PCR analysis for BMP-2 (a) and osteopontin (b) mRNA expression versus shear stress for timepoints 1, 4, 8, 14, and 21 (a) and 14 and 21 (b). Day 1, 4, and 8 BMP-2 data is normalized to day 1 zero shear, day 14 and 21 BMP-2 and OPN data is normalized to day 14 zero shear. Expression levels of BMP-2 and osteopontin are dependent on shear stress with higher shear stresses correlating to greater expression levels. The magnitude of this increase becomes stronger at later timepoints.