
Figure 4.
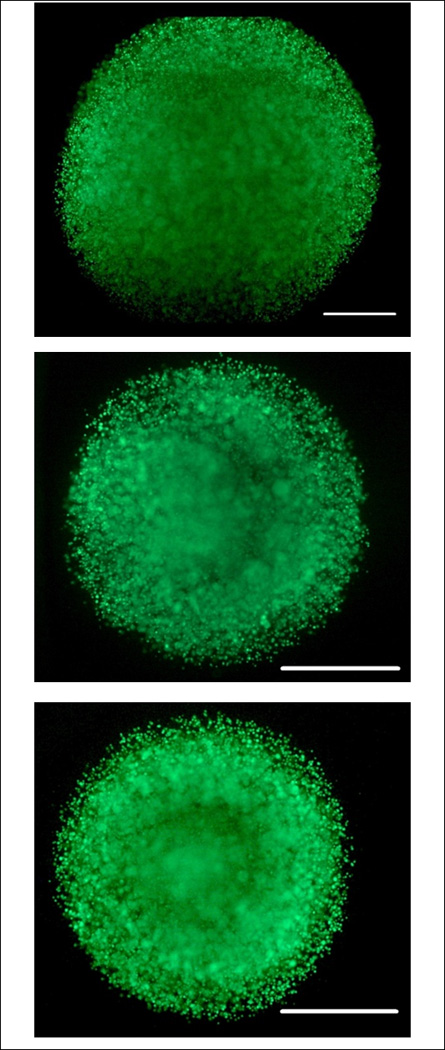
Live Dead Images of entire bead (top), inner annuli (middle), and small bead (bottom) after one day of bioreactor culture. Scale bar represents 1000 µm. Note small bead and inner annuli are approximately the same size and half that of the entire bead. Cells appear viable in all groups throughout the bead.