
Figure 5.
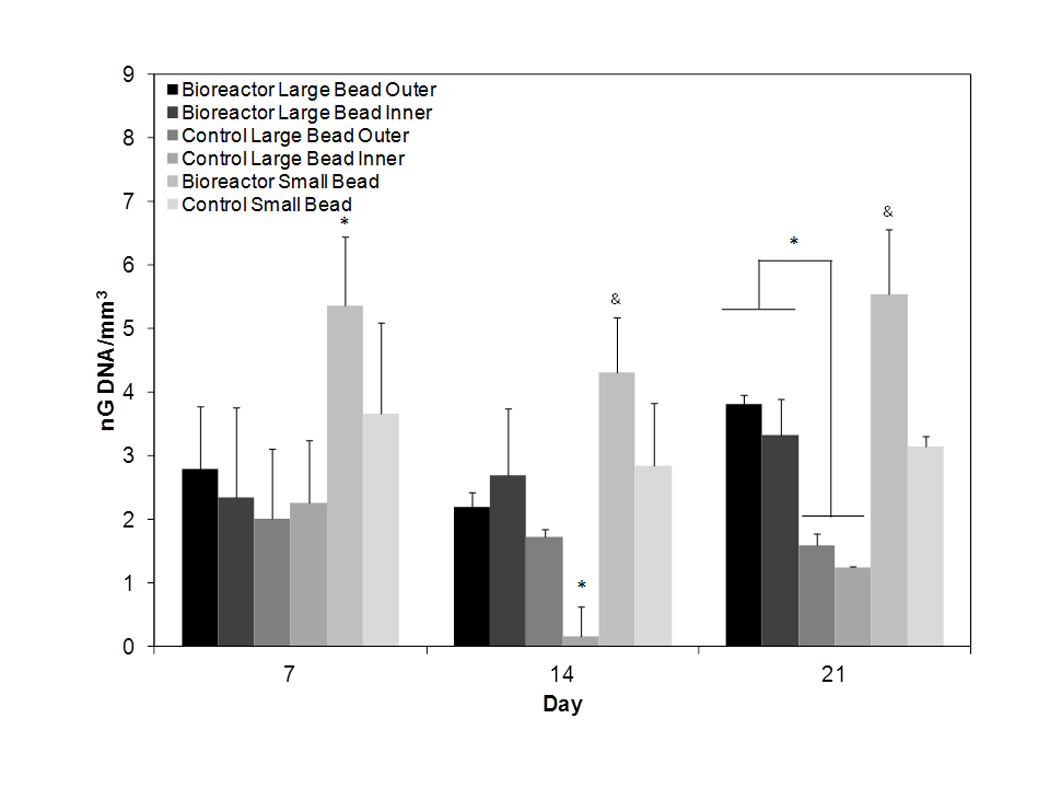
DNA amount normalized to scaffold volume for days 7, 14, and 21. On day seven similar proliferation is observed in all groups except bioreactor small bead. By day 14 control inner exhibits decreased proliferation. On day 21 note significantly higher DNA amounts in bioreactor cultured large beads as compared to static cultured large beads. The symbols *, & represent statistical significance within a timepoint (p < 0.05). Groups with symbol * or & are statistically different from all groups except those groups with the same symbol. Groups with the same symbol are statistically similar to each other.