
Figure 7.
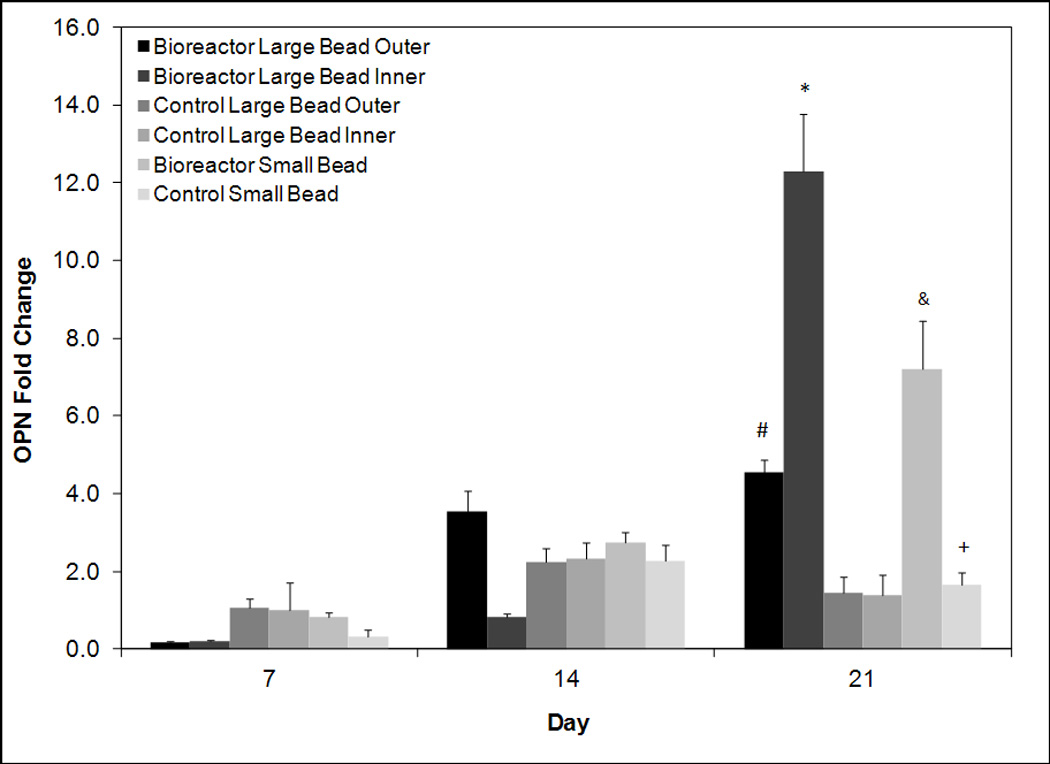
RT-PCR analysis for days 7, 14, and 21 for late osteoblastic marker osteopontin. Values are normalized to day seven control large bead inner. All groups are cultured in osteogenic media. On day 21 expression levels are significantly greater in bioreactor inner than all other groups. The symbols (*, #, &, +) indicate statistical significance from all other groups within a timepoint (p < 0.05). Groups with symbol *, #, & or & are statistically different from all groups except those groups with the same symbol. Groups with the same symbol are statistically similar to each other.