
Figure 9.
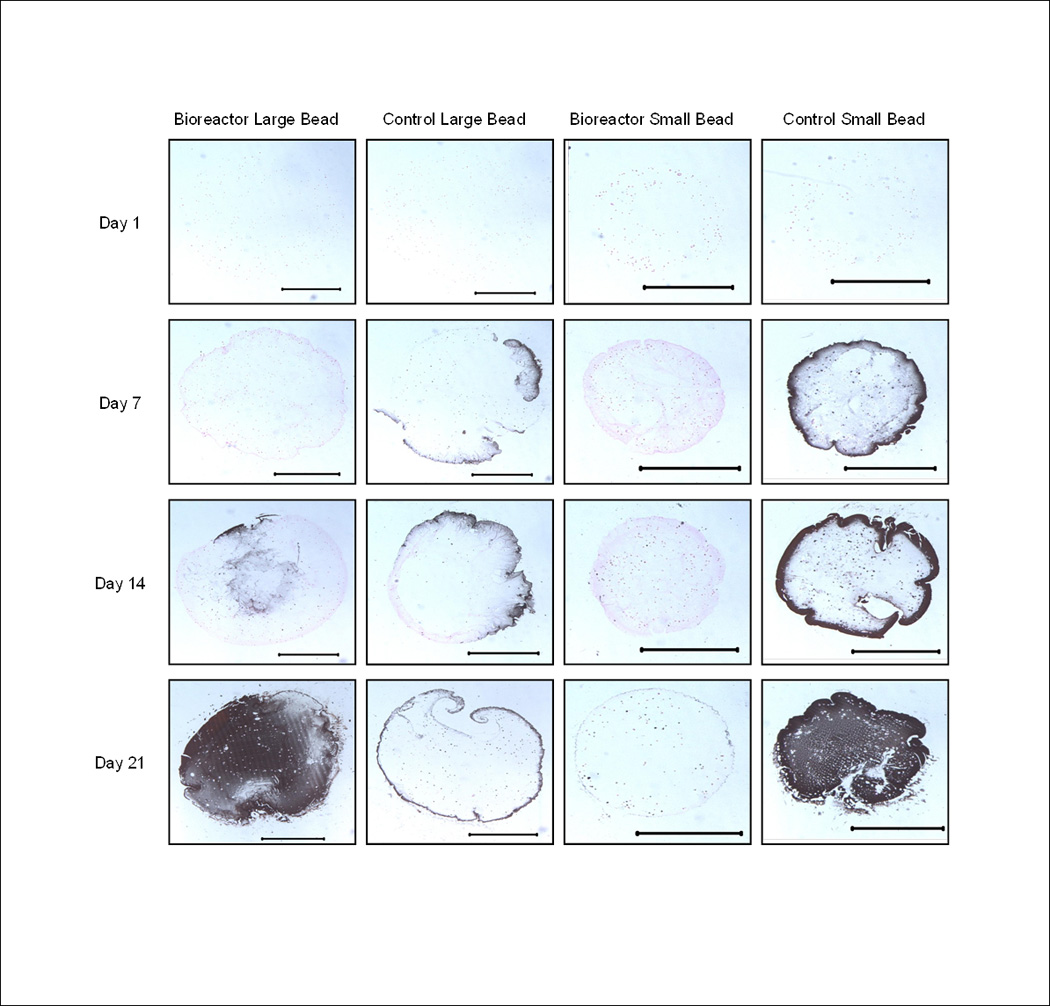
Representative images of bioreactor cultured large beads, statically cultured large beads, bioreactor cultured small beads, and statically cultured small beads. Scale bar represents 1000 µm. Note increased calcium staining on day 21 and the highest overall percentage of calcified area in the bioreactor large bead on day 21.