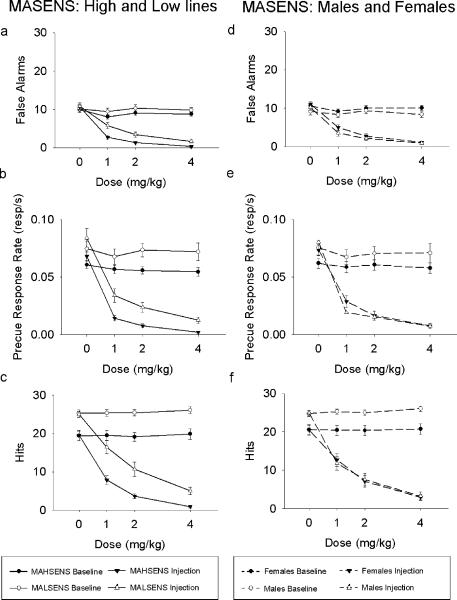
Fig. 5.
Mean (± SEM) indices of inhibition as a function of MA dose for the MASENS mice. Left, comparing high and low lines: (a) the number of trials on which mice responded during the No-go cue and (b) the rate of response during the precue period. (c) shows the number of Go trials on which the mouse made a response (hits) as a function of MA dose. Right, comparing males and females: (d) the number of trials on which mice responded during the No-go cue and (e) the rate of response during the precue period. (f) shows the number of Go trials on which the mouse made a response (hits) as a function of MA dose.

