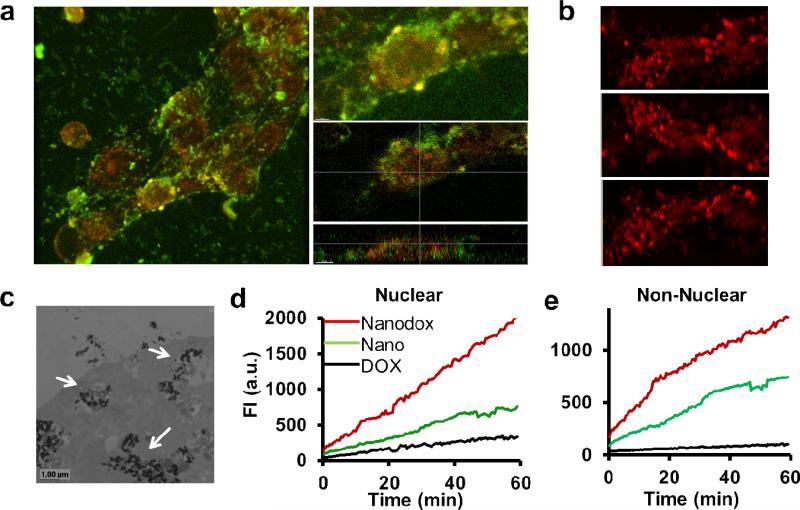
Figure 6. Nuclear mapping of Nano-drug system in a dynamic cellular environment.
a, Live cell snapshots of drug-sensitive cells treated with Nanodox labeled with FITC. Drug DOX is in red, nanoparticles are in green. Nanoparticles mostly remain in the cytoplasm while majority of the drug is in the nuclear region. b, Z-images of Nanodox showing the cellular uptake of DOX. c, Direct imaging of nanoparticles using TEM. Arrows indicate nanoparticles in the cytoplasm of the cancer cell. d, Plot shows nuclear and non-nuclear uptake of free DOX, Nanodox and nano (FITC-labeled SPIONPs). Uptake pattern is exponential both in nuclear and non-nuclear regions. DOX loaded on the nanoparticles has the highest rate of reaching the nucleus compared to free DOX.

