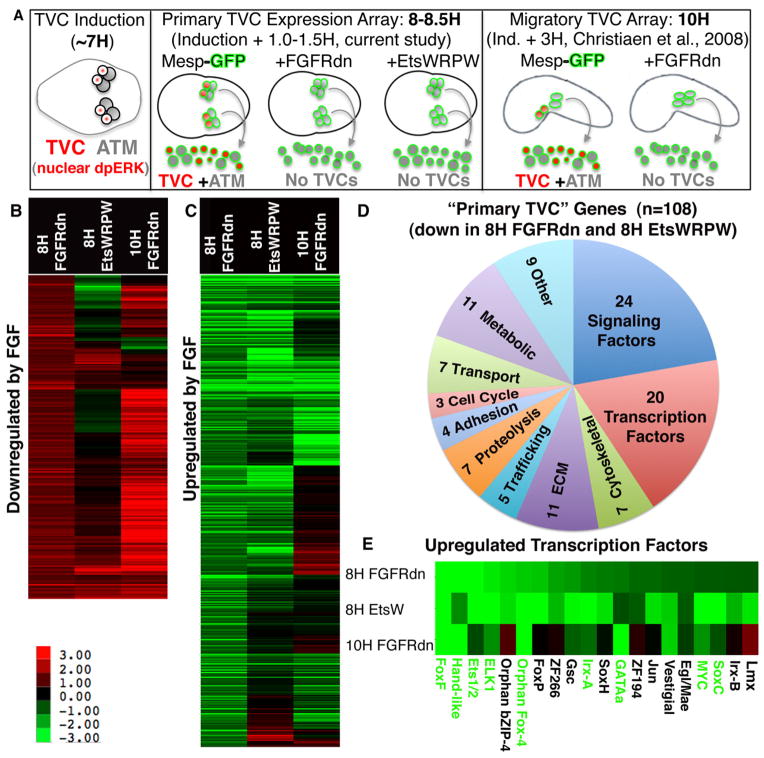
Figure 1. Primary FGF/Ets dependent gene expression in the TVC lineage.
(A) Schematic illustrating staged harvesting of dissociated founder lineage cells for microarray analysis relative to the time of initial TVC induction. H = hours post fertilization in this and all subsequent figures. Nuclear dpERK = nuclear localization of di-phosphorylated Extracellular-signal Regulated Kinase indicative of MapK signaling cascade activity (B, C) log2 fold changes (scale shown below panel B) for all probe sets showing a robust (fc > log20.8) and significant (p< 0.06) increase (B) or decrease (C) in the Mesp-FGFRdn samples (8H FGFRdn). These cut-off values were modeled on those employed for the 10H array (Christiaen et al., 2008). For each panel, average fold change values from the corresponding probe sets from the early Mesp-EtsWRPW samples (8H EtsWRPW) and previously published 10H Mesp-FGFRdn samples (Christiaen et al., 2008) are also shown. (D) Pie chart showing the predicted functions of all 108 annotated “primary TVC genes.” (E) Fold change data for the 20 primary TVC transcription factors, green lettering indicates confirmation of early TVC expression by in situ expression assay (see Fig. 2).

