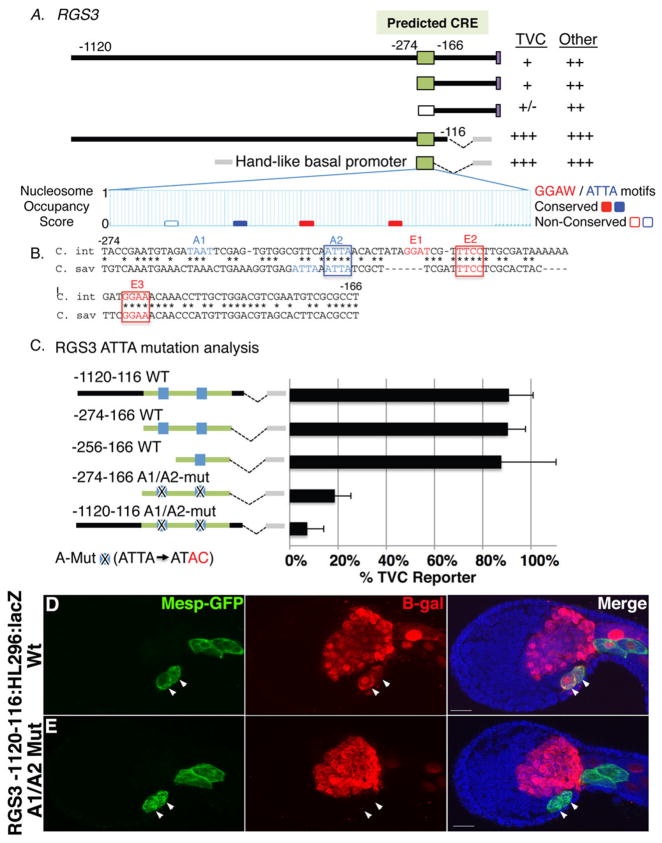
Figure 6. Reporter analysis of the predicted RGS3 primary TVC regulatory element.
(A) Diagram of RGS3 reporter constructs numbered by their distance from the translation start codon along with the resulting expression levels in the TVCs and other lineages (+++ and + as described in Fig. 3; ++ = ~10–20% of stained embryos; +/−= no expression in some trials but sporadic expression at very low levels in other trials). At the bottom of panel (A) is a graphical representation of nucleosome occupancy scores (Segal et al; 2006) for the predicted CRE taken from the Aniseed Genome Browser (http://www.aniseed.cnrs.fr/). (B) Alignment of the conserved 108bp CRE, labeling as described in Fig. 3. (C) Mutational analysis of ATTA co-motifs in RGS3 reporter constructs as indicated, labeling as described for previous figures (2–3 trials, N>80 for each sample). (D–E) Representative RGS3-1120-116:HL296:lacZ transgenic embryos co-electroporated with a Mesp-GFP construct. (D) Wildtype reporter construct drives robust reporter expression (red) in the TVCs (arrowheads). (E) ATTA mutations (A1/A2-mut, as diagrammed in C) abrogate TVC reporter expression (arrowheads). Scale bar = 20um.

