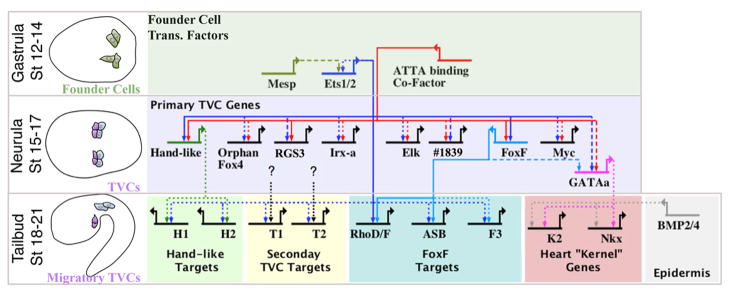
Figure 7. Model of the TVC gene regulatory network.
BioTapestry (Longabaugh, 2011) was employed to construct a hypothetical TVC GRN. Schematics to the left indicate relevant stage. Top row displays initial network in the B7.5 founder cells. Middle row displays hypothesized Ets1/2 regulation of representative primary TVC genes as detailed in the current study. Bottom row displays presumed Ets1/2 feed-forward regulation of later, secondary TVC genes (Christiaen et al., 2008) and presumed conserved regulation of “kernel” genes (Davidson, 2006) by GATAa and Smad (downstream of epidermal BMP signaling, Christiaen et al. 2009). GATAa is positioned to reflect the apparent delay in the expression of this gene relative to other primary TVC genes such as Hand-like and FoxF (Ragkousi et al., 2011) and includes potential regulation through conserved FoxF binding motifs in the intronic TVC enhancer element (see Supplemental Fig. 4). We have also included hypothetical feed-forward regulation of sub-sets of secondary TVC genes by Ets1/2 and other primary TVC transcription factors (black dotted lines). We are interested in testing whether this hypothesized differential feed-forward architecture may serve to regulate discrete morphogenetic modules involved in TVC behavior. Line format represents the varying levels of evidence for hypothesized cis-regulatory connections: solid lines = validation through mutation of presumed binding sites; dashed lines = presence of binding motif in experimentally tested enhancer; dotted lines = no experimental evidence. H1, H2, T1, T2, F3 and K2 represent hypothetical sets of differential Ets1/2 target genes as labeled.

