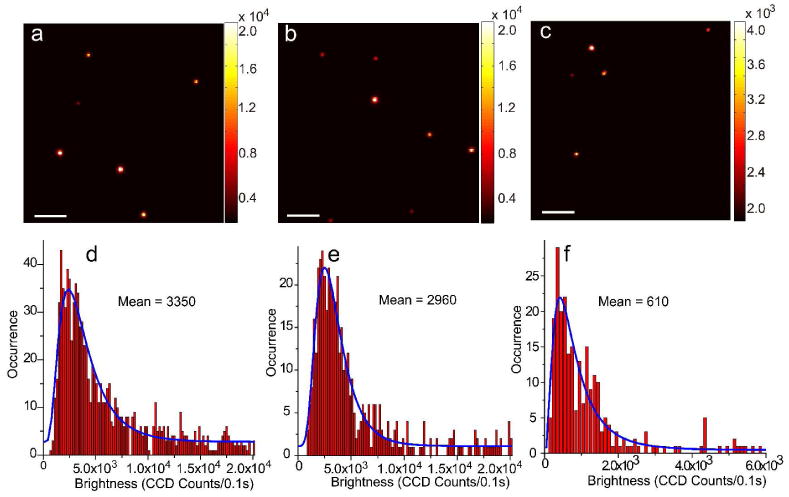
Figure 3.

Single-particle fluorescence images of (a) PFBT-C2, (b) PFBT-C14, and (c) PFBT-C50 dots, obtained under identical excitation and detection conditions. Scale bars represent 10 μm. Histograms of intensity distribution of single-particle fluorescence for (d) PFBT-C2, (e) PFBT-C14, and (f) PFBT-C50 Pdots; the blue curves were obtained by fitting a lognormal distribution to the histogram, and gave 3350, 2960 and 610 mean CCD counts for the three types of Pdots, respectively.
