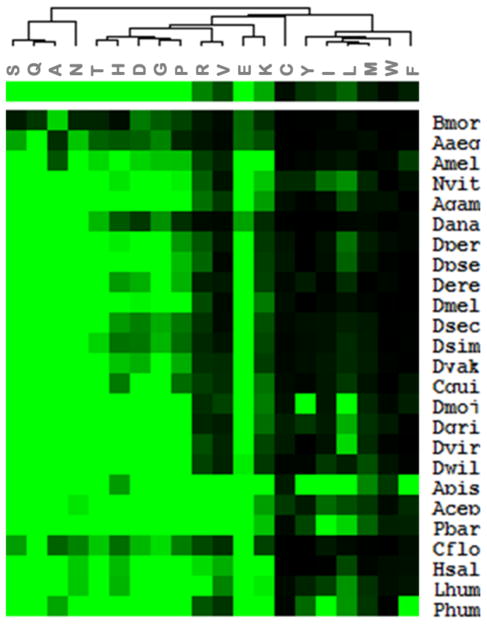
Figure 3.
Variation in the representation of amino acids by the simple sequence repeats among the 25 insects based on hierarchical cluster analysis. The green color represents high and black color shows low representation. The insect names (4 letters) are shown as rows and the amino acids (single letter abbreviations) are shown as columns. The clustering tree among the amino acids is also shown.

