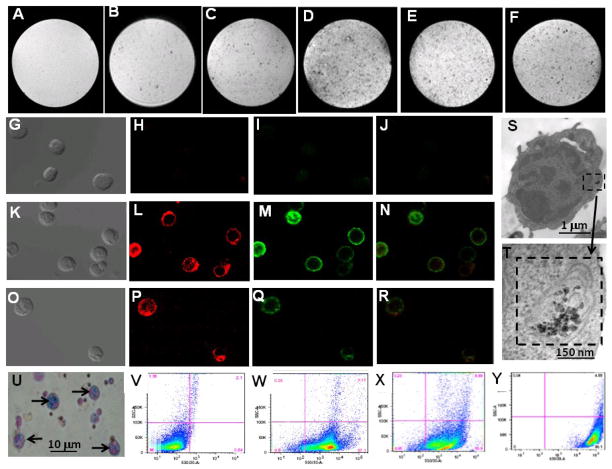
Figure 2.
Characterization of ex-vivo labeled rat T-cells: (A–F) MRM images of gelatin phantoms of T-cells labeled with iron-oxide particles; (A) no particles (control); (B) IOP; (C) IOPC; (D) IOPC-NH2; (E) IOPC-NH2-FITC; and (F) IOPC-NH2-DyLight 649. MRI experiments were carried out in an 11.7-T MRI instrument with in-plane resolution of 78 μm; (G–R) light (G, K and O) and confocal microscopic images (H, I, J, L, M, N, P, Q and R) of T-cells labeled with IOPC-NH2-DyLight 649 particles; (G–J) images of unlabeled T-cells (control); (K–N) T-cells co-cultured with IOPC-NH2-DyLight 649 particles, following treatment with anti-CD3-FITC; (N) is an overlay imaging of (L) and (M); (O–R) T-cells co-cultured with IOPC-NH2-DyLight 649 particles, following treatment with mouse anti-PEG mAb and anti-mouse IgG-FITC; (R) is an overlay imaging of (P) and (Q); (S–T) TEM images of T-cells labeled with IOPC-NH2 particles; (T) is an enlarged view of cytoplasmic particles found in (S); (U) Prussian blue iron staining of T-cells labeled with IOPC-NH2 particles; (V–Y) flow cytometry analysis of T-cells labeled with IOPC-NH2 series particles; (V) T-cells (control); (W) T-cells after treatment with anti-CD3-FITC; (X) T-cells labeled with IOPC-NH2 following treatment with anti-PEG mAb and anti-mouse IgG-FITC; and (Y) T-cells labeled with IOPC-NH2-FITC particles.

