
Fig. 5.
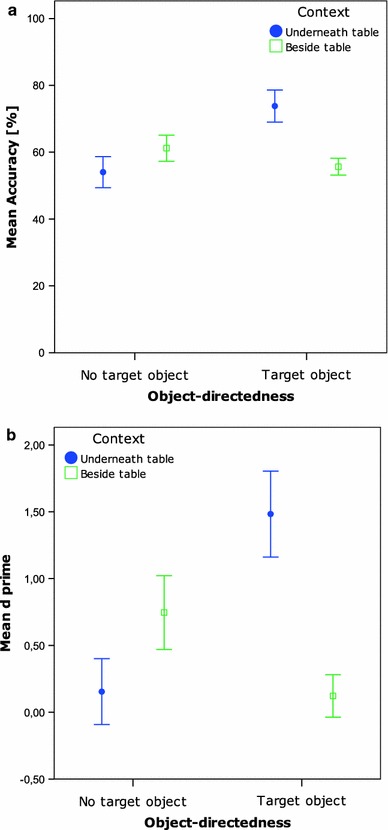
a Mean accuracy per condition Exp. 2B. Bars represent 95% confidence intervals of SE. b Mean d’ per condition Exp. 2B. Bars represent 95% confidence intervals of SE
Official websites use .gov
A
.gov website belongs to an official
government organization in the United States.
Secure .gov websites use HTTPS
A lock (
) or https:// means you've safely
connected to the .gov website. Share sensitive
information only on official, secure websites.
a Mean accuracy per condition Exp. 2B. Bars represent 95% confidence intervals of SE. b Mean d’ per condition Exp. 2B. Bars represent 95% confidence intervals of SE