
Fig. 8.
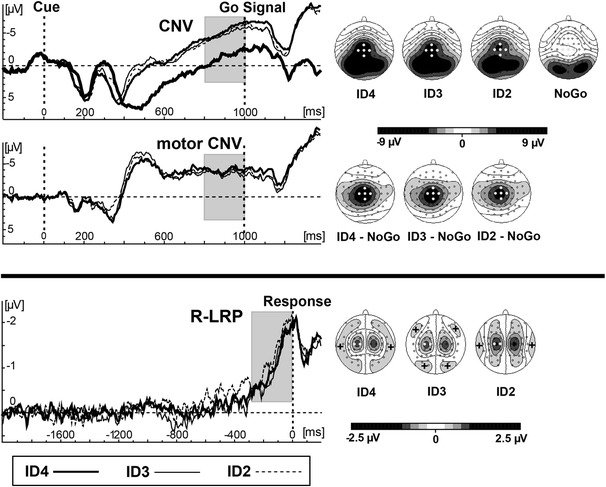
Top grand average waveforms derived from pooled electrode sites Cz, C1, C2, FCz and CPz, highlighted as white circles and scalp voltage distributions during the last 200 ms before the go signal onset. The “motor CNV” was computed by subtracting the CNV in the NoGo condition from the CNV in each of the action planning conditions. Bottom grand average waveforms derived from pooled electrode pairs C1/2 and C3/C4, highlighted as white circles and scalp voltage distributions of lateralized activity during the last 200 ms before response onset. The grey bars indicate the latency windows for amplitude analysis. The grey-shaded areas at all scalp topographies denote scalp activity of negative polarity, unless the “+” sign is included, which denotes activity of positive polarity