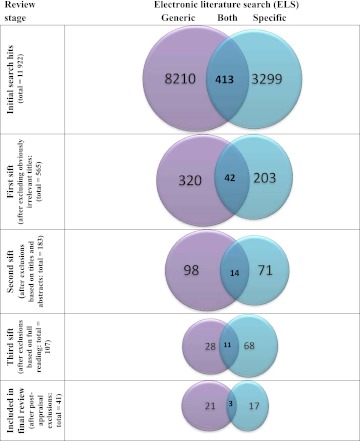
Figure 1.
Review study selection flow chart: studies identified by the ‘generic’ search only (purple circle), ‘specific’ search only (light blue circle) and by both searches (dark blue intersect). From the above figures the following can be calculated. Generic ELS: sensitivity =58.5%; precision =0.3%; number needed to read =112 (1.3%). Specific ELS: sensitivity =48.8%; precision =0.5%; number needed to read =85 (2.3%). An initial manual search identified 10 articles for full reading, of which four were included in the final review. These studies were also identified from the generic ELS and are included as such in the figure.

