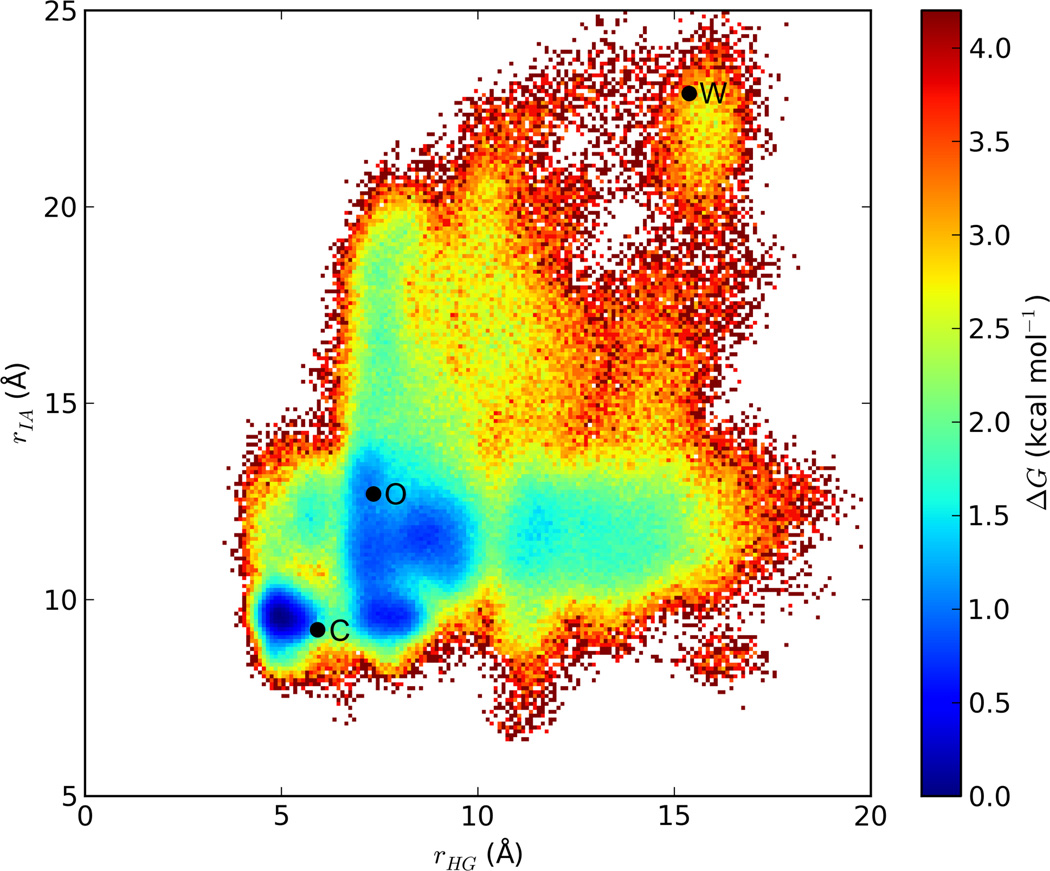
Figure 3.
Relative free energy map of the urease flap opening. The points marked by “C,” “O,” and “W” represent respectively the closed, open and wide-open structures shown in Figure 2. Points C and O represent the initial X-ray structures of the closed- and open-flap models, being PDB IDs 1FWJ and 1EJX respectively; for the latter structure, the flap was added by homology modeling. Point W is a representative wide-open conformation selected from the simulation trajectory of 1FWJ.

