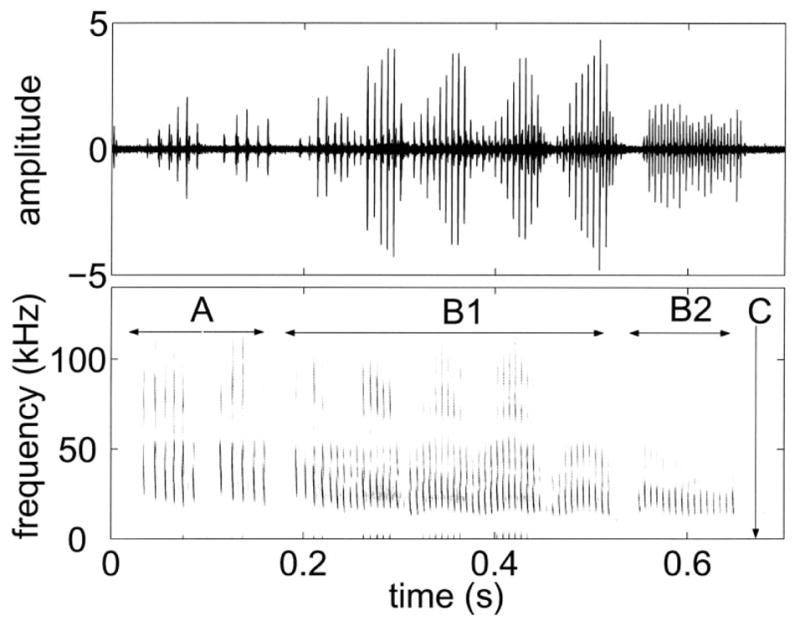
FIG. 1.

The top panel shows the time waveform of a series of E. fuscus vocalizations recorded in the laboratory. The bottom panel shows the spectrogram of this signal. Different stages of foraging are marked out. A is the approach phase, B1 is buzz1, B2 is buzz2, while C refers to the time of contact of the bat with the prey.
