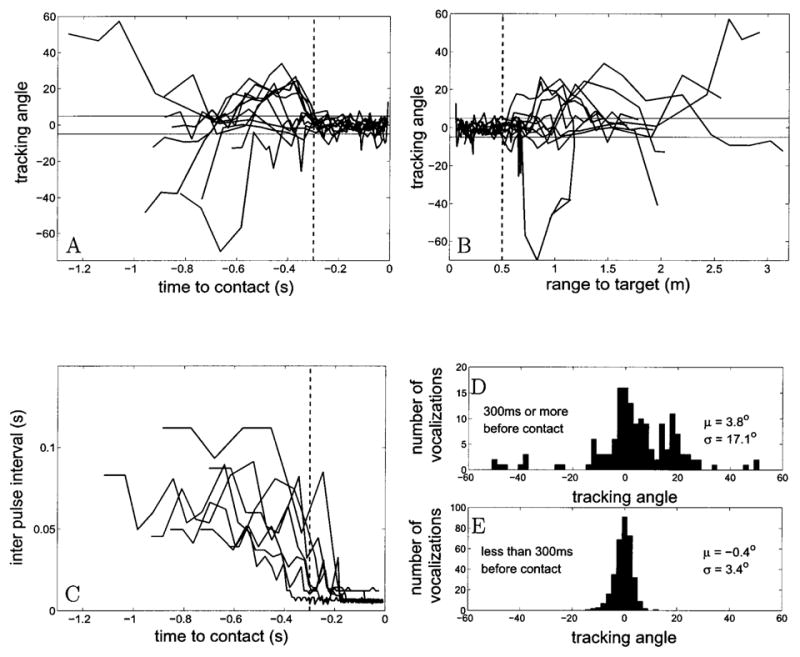
FIG. 10.

This plot summarizes the results of analysing the angular deviation between the beam axis and the target (the tracking angle) for 13 trials. A shows the tracking angle for each trial plotted against time to contact with the target(zero being time of contact). The vertical dotted line marks 300 ms before contact. B is a plot of tracking angle against range to target. The vertical dotted line marks .5 m to target. In plots A and B the solid horizontal lines mark ± 5°. C shows the interpulse interval plotted against time. D and E show the distribution of tracking angles at different time periods before target contact. D shows data when there is more than 300 ms to contact, while E shows data when the bat is within 300 ms of contact.
